Fantasy Analysis
Early-Round Offense Concentration And Pace
When several players from one offense go in the first eight rounds, does that concentration actually beat draft price? And does pace help explain which stacked offenses pay off?
This is a case study, not a prediction model. The useful takeaway is modest: concentration can point to ceiling, but it needs projected volume, role stability, and price discipline before it becomes an action.
The Thesis
- Concentration alone is not the edge. The best per-player bucket was four first-eight-round players, at only +1.2 PPR over expectation per player.
- Same-season pace explains more than draft-day pace. Same-year plays per game correlates +0.11 with per-player return; prior-year plays per game correlates -0.03.
- The 2026 output is a watchlist, not a conclusion. Chicago has the most early-round concentration in the current snapshot, but that needs projected volume and role checks before it matters.
- This is not an Underdog advance-rate claim. The study uses redraft ADP and season PPR return. Best-ball tournament claims need actual contest data.
High Concentration Is Mostly A Ceiling Signal
The first check is whether concentrated offenses beat price per player. The answer is mixed: total team return naturally rises with more early players, but per-player return does not improve with each added teammate.
That matters because the real decision is whether the next player from that offense is still worth the cost.
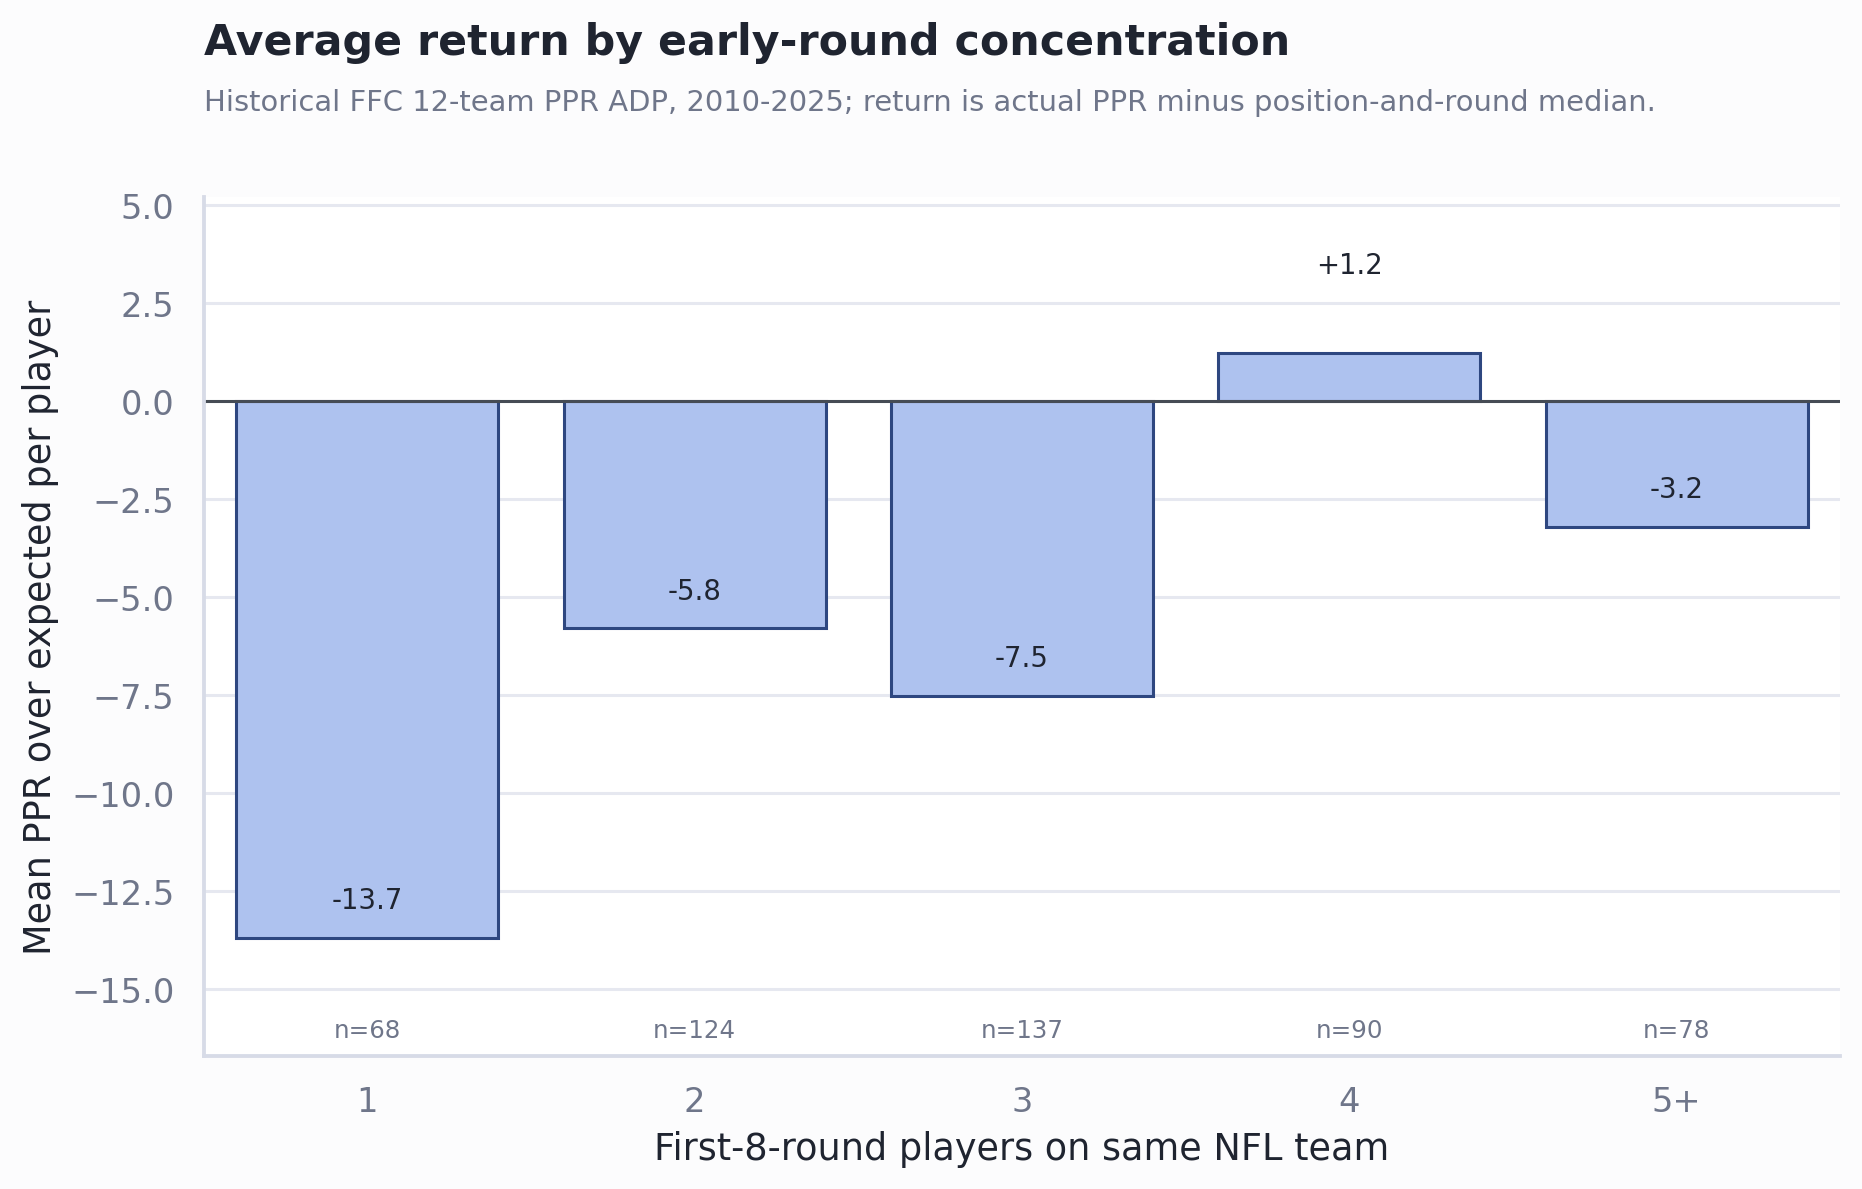
| Top-96 players | Team-seasons | Total POE | POE / player | Beat-exp. rate |
|---|---|---|---|---|
| 1 | 68 | -13.7 | -13.7 | 49% |
| 2 | 124 | -11.6 | -5.8 | 48% |
| 3 | 137 | -22.6 | -7.5 | 49% |
| 4 | 90 | +4.9 | +1.2 | 54% |
| 5+ | 78 | -17.4 | -3.2 | 47% |
Pace Helps Explain Winners
The strongest pace relationship appears when we look at the season that actually happened. High-volume offenses create more chances for concentrated players to pay off, but the scatter is wide.
The same play-volume environment can produce very different returns depending on injuries, role concentration, touchdown distribution, and whether ADP already priced in the offense.
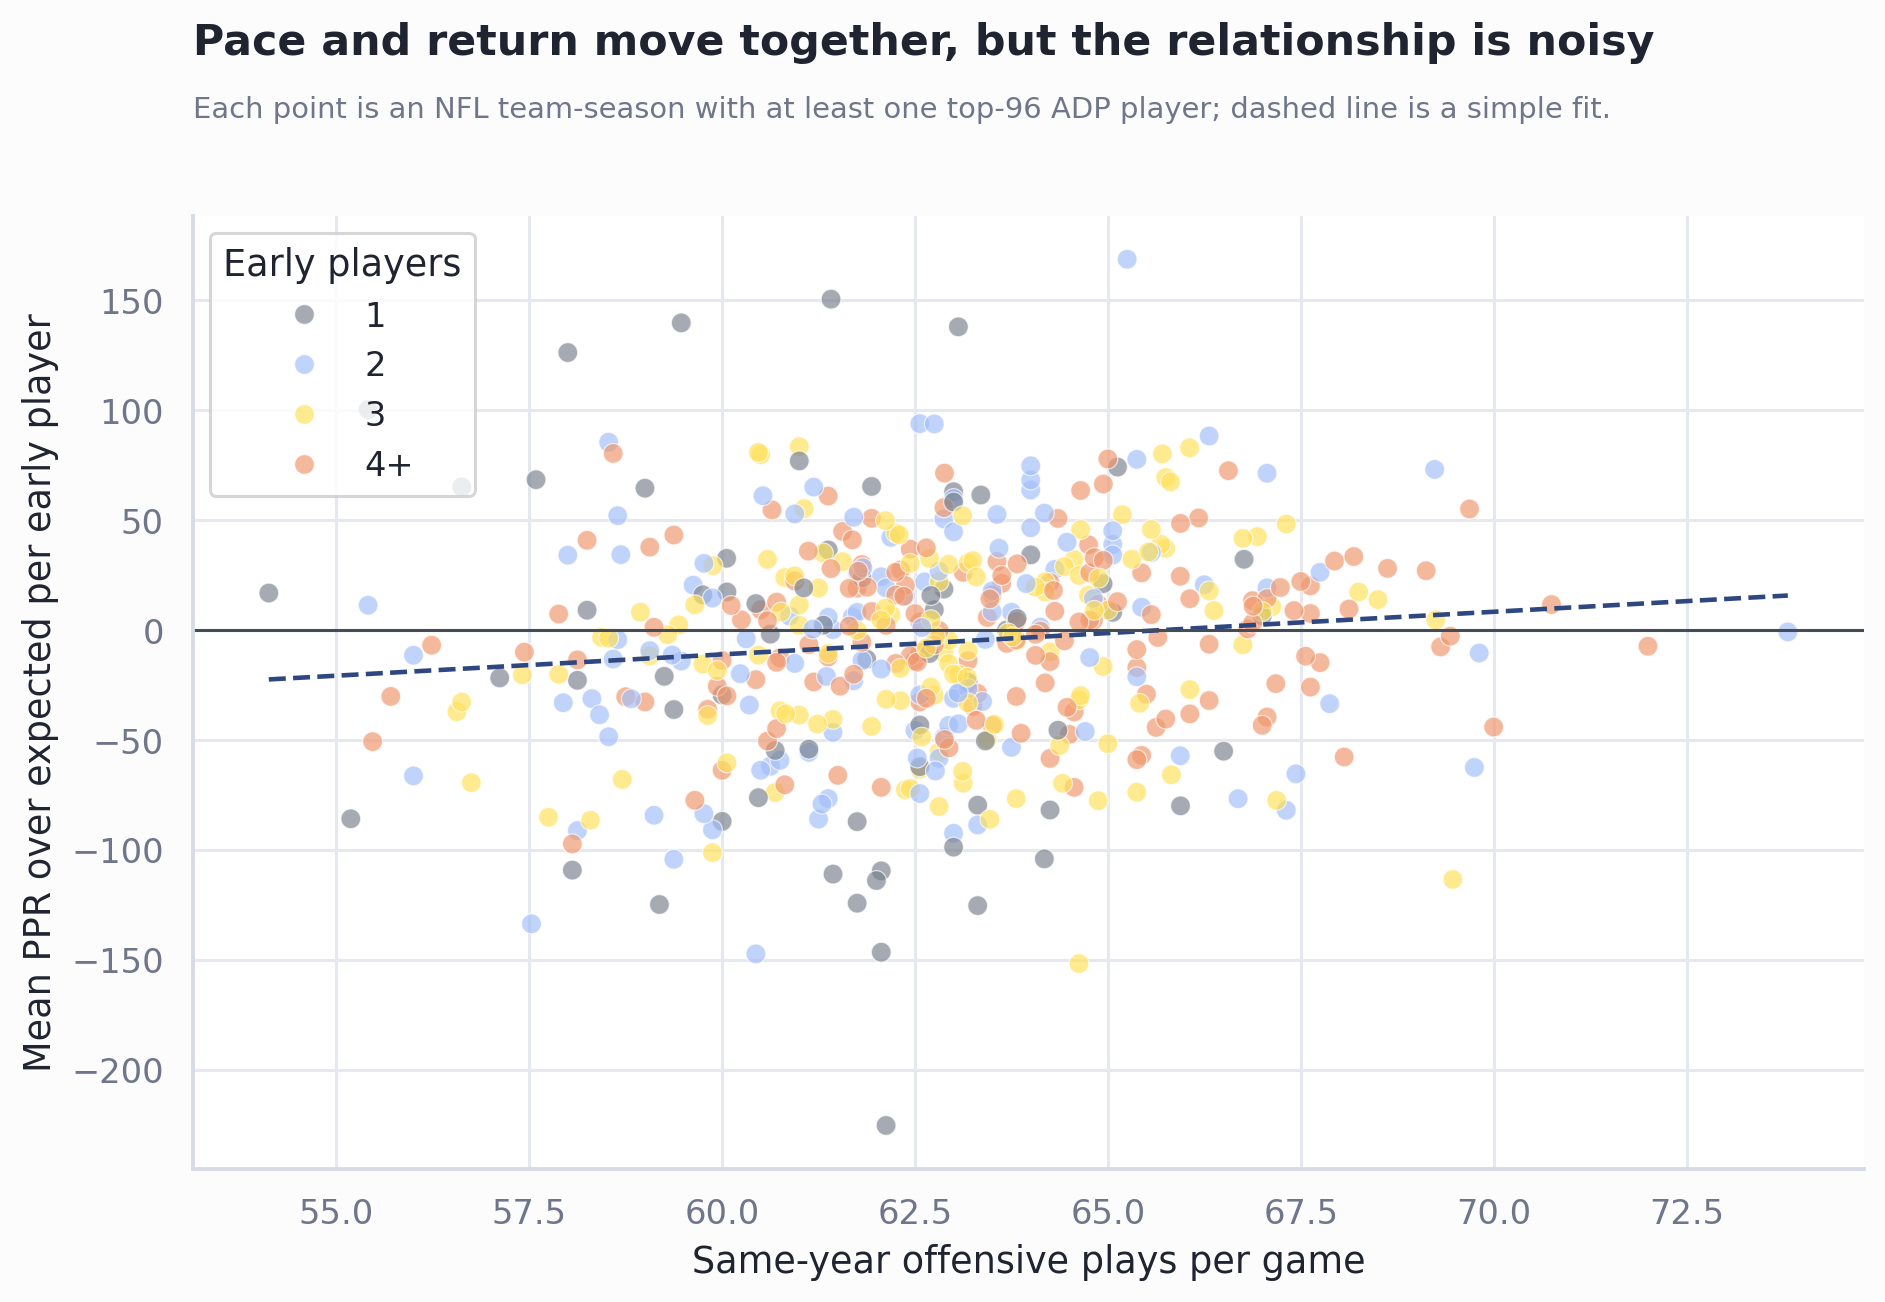
Prior-year pace is weaker, which is the draft-day catch. A drafter only knows prior pace and projected pace before the season. Same-year volume matters; blindly importing last season’s pace leaves too much noise.
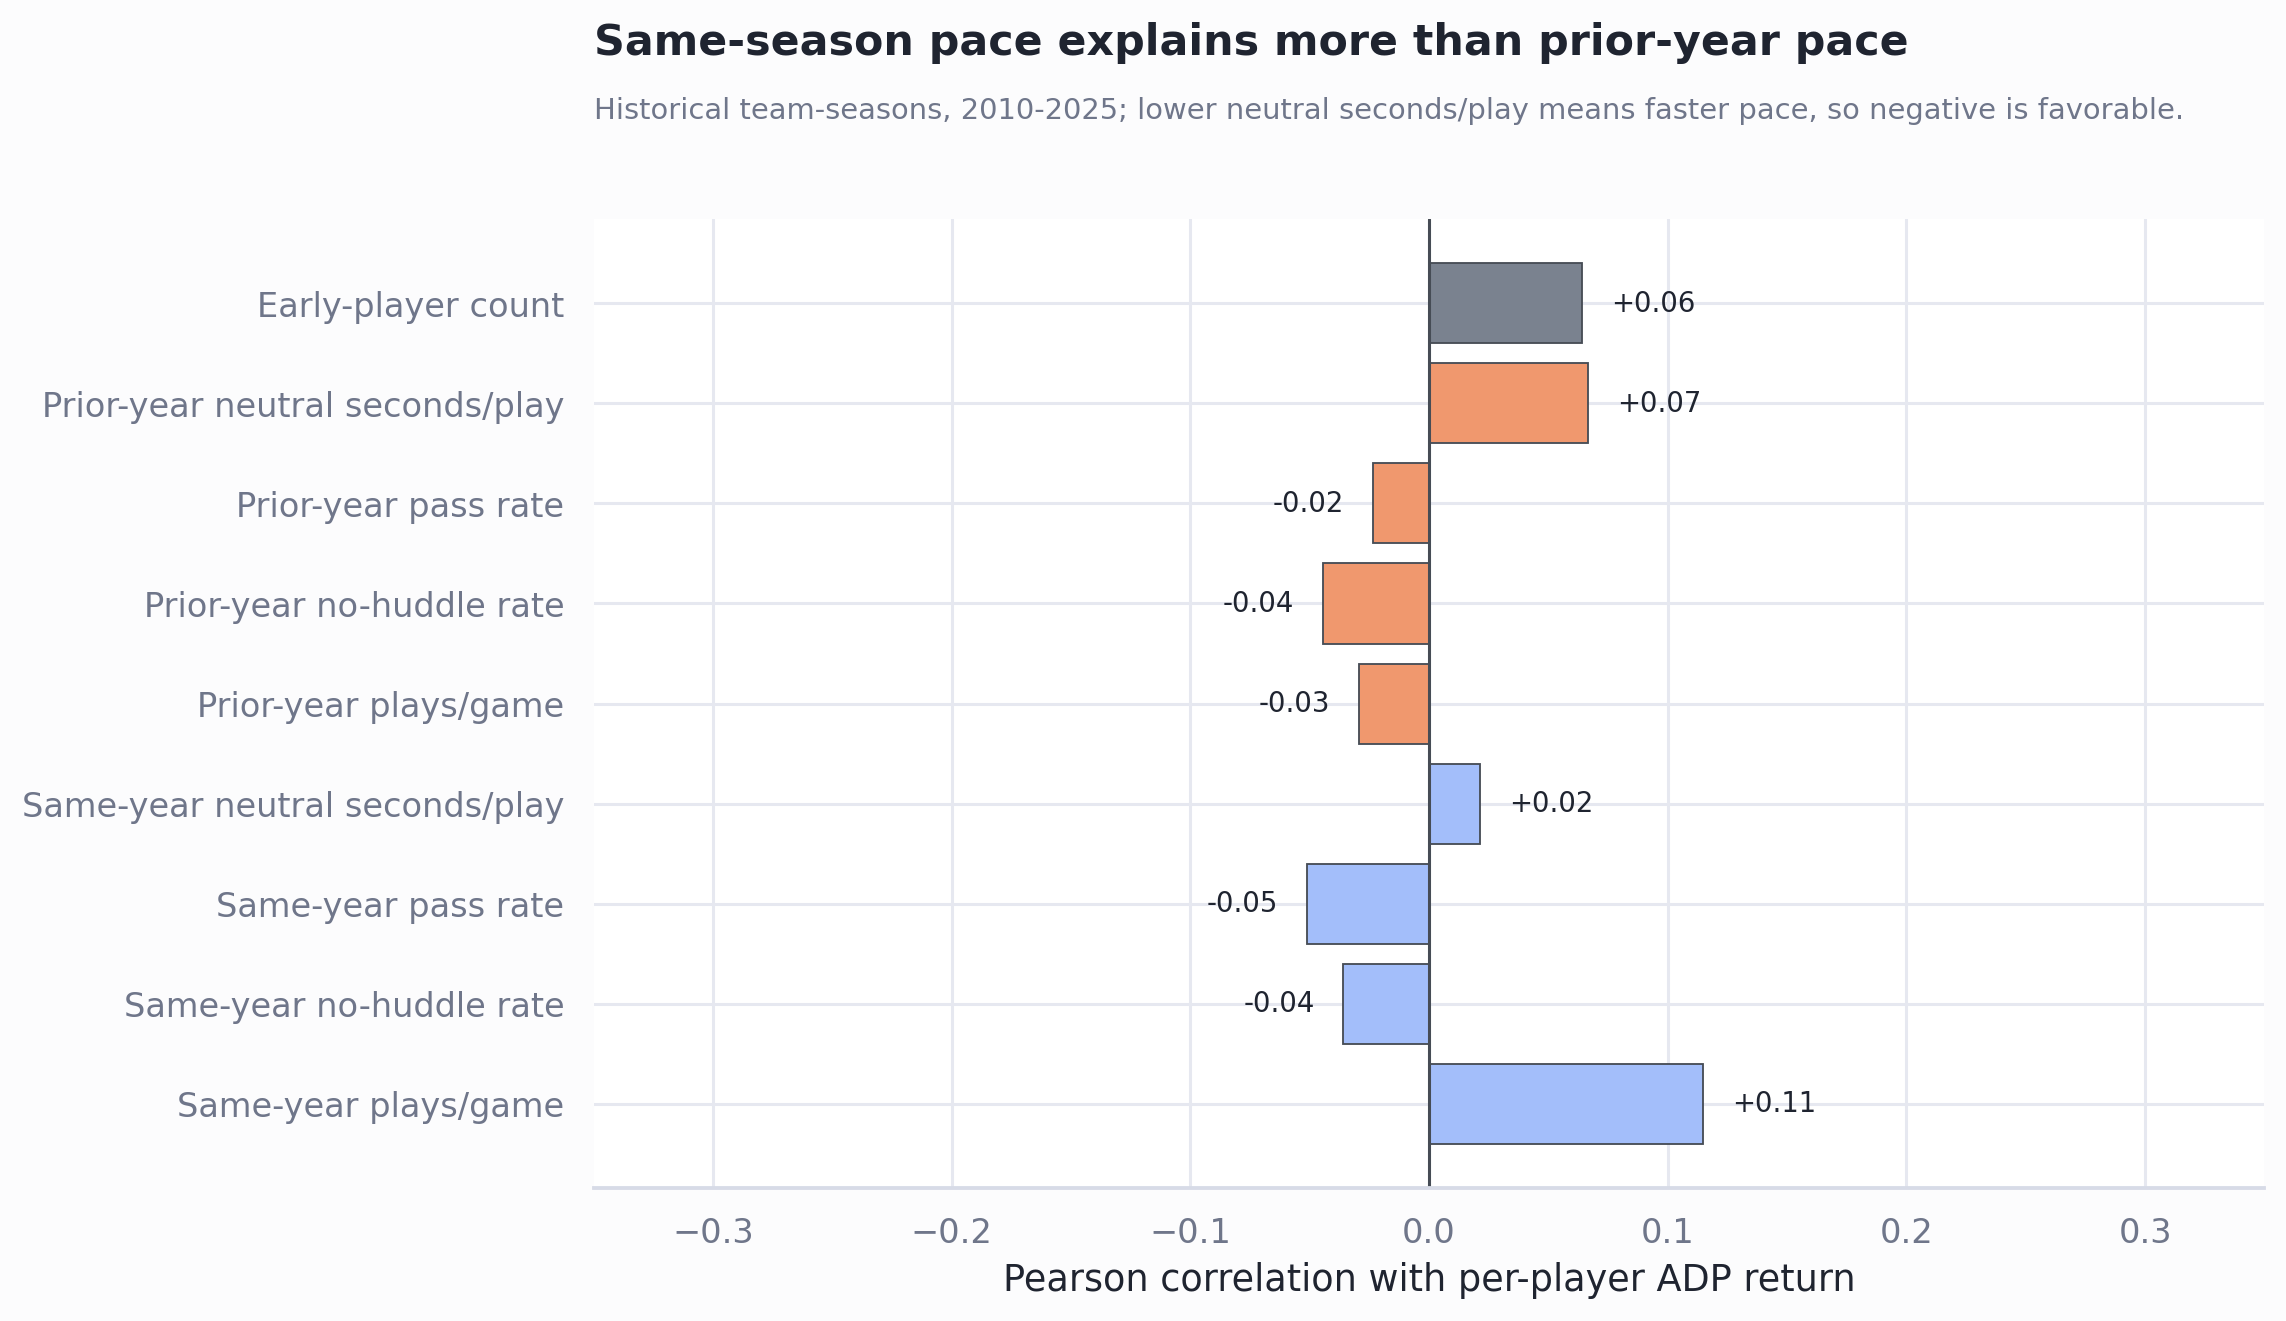
Practical read: use pace to downgrade fragile concentrated offenses with slow or weak projected volume, and to keep promising concentrated offenses on the target list. Do not treat the count of top-96 teammates as a buy signal by itself.
2026 Watchlist
This is a watchlist for projection checks, not a buy list. The teams below have the most players inside the first eight rounds of the current snapshot, anchored to 2025 pace.
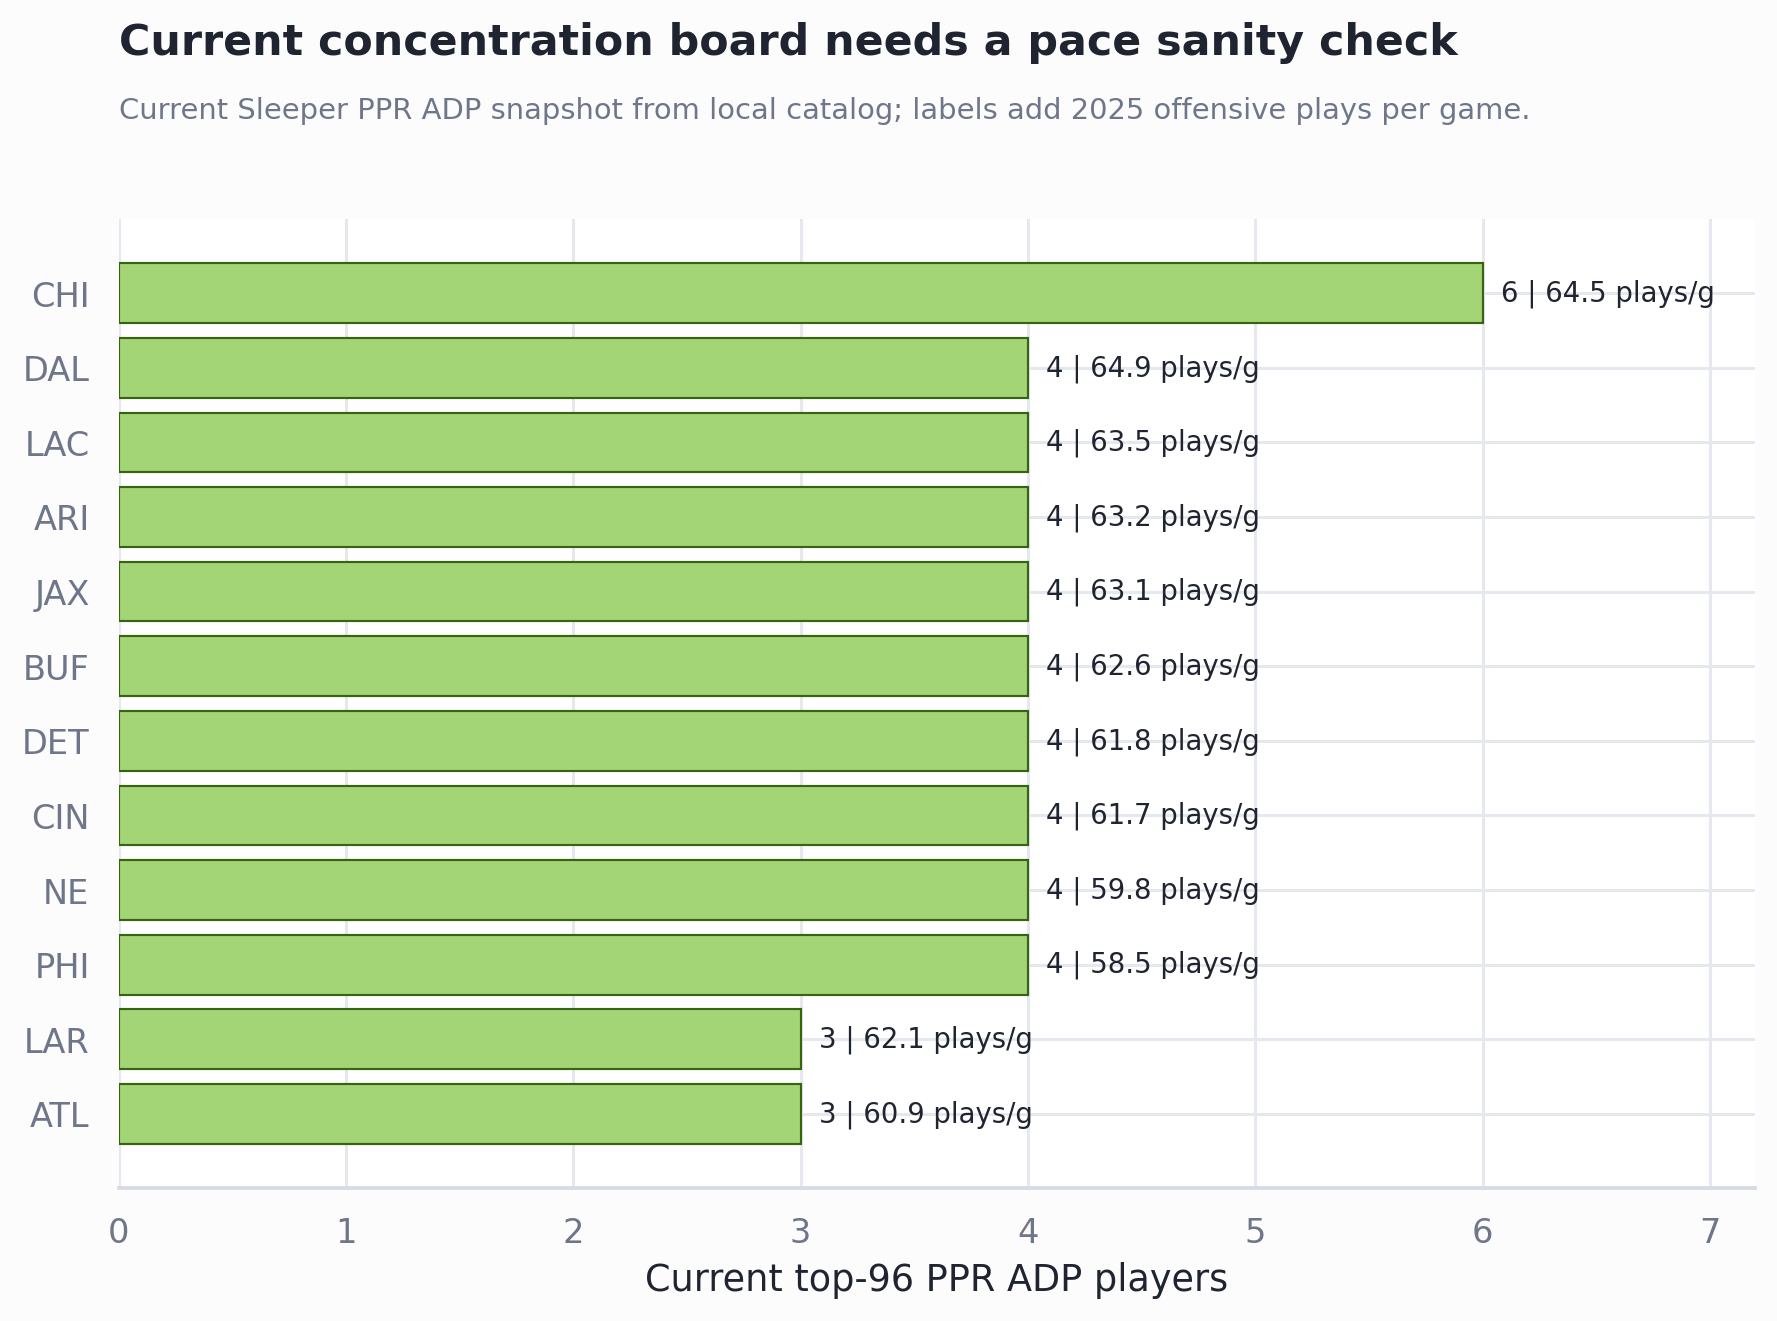
| Team | Top-96 count | Avg ADP | 2025 plays/g | Pace note |
|---|---|---|---|---|
| CHI | 6 | 68.0 | 64.5 | fast-volume prior |
| CIN | 4 | 29.6 | 61.7 | middle-volume prior |
| DET | 4 | 39.1 | 61.8 | middle-volume prior |
| DAL | 4 | 43.9 | 64.9 | fast-volume prior |
| BUF | 4 | 47.1 | 62.6 | fast-volume prior |
| NE | 4 | 53.6 | 59.8 | middle-volume prior |
| ARI | 4 | 54.0 | 63.2 | fast-volume prior |
| PHI | 4 | 57.5 | 58.5 | slow-volume prior |
| LAC | 4 | 61.2 | 63.5 | fast-volume prior |
| JAX | 4 | 82.2 | 63.1 | fast-volume prior |
Chicago leads on raw concentration. Cincinnati and Detroit pair concentration with lower average draft cost. None of that should be treated as a standalone draft command.
Before Acting
- Refresh ADP and pace before using this for 2026 decisions. The current application uses a June 13, 2026 ADP snapshot and 2025 pace.
- Add projected inputs: Vegas team totals, play-caller changes, projections, and role stability.
- Keep the model modest. A 0.01 prior-year R2 is a sanity check, not a thesis.
- Do not stretch this into best-ball tournament claims without actual best-ball pick and entry data.
Sources and freshness: Historical ADP is Fantasy Football Calculator 12-team PPR from 2010-2025. Outcomes and pace use nflverse season stats and play-by-play. The current 2026 application uses redraft PPR ADP loaded June 13, 2026 and 2025 pace. Return is position-and-round-adjusted PPR over expectation, so it is descriptive rather than causal.