Fantasy Football Analysis
NFL Team Yardage Predictability
Team yardage is a useful fantasy input, but it is a dangerous shortcut when it gets treated like destiny. Last year’s offense or defense tells us something. It does not tell us enough to skip the mechanism check.
This report looks at NFL regular-season team passing and rushing yards from 1999-2025, then asks how often teams make unusually large year-over-year jumps. The current application is a 2026 watchlist built from local schedule, injury, continuity, roster, and market-support sources.
The Thesis
- Big jumps are real but low-base-rate. Across 3,316 team-metric seasons, teams made significant positive yardage moves 15.5% of the time.
- Previous-year level is only moderately sticky. Offense passing had the strongest year-over-year level signal at R2 0.30; defense rushing was weakest at R2 0.13.
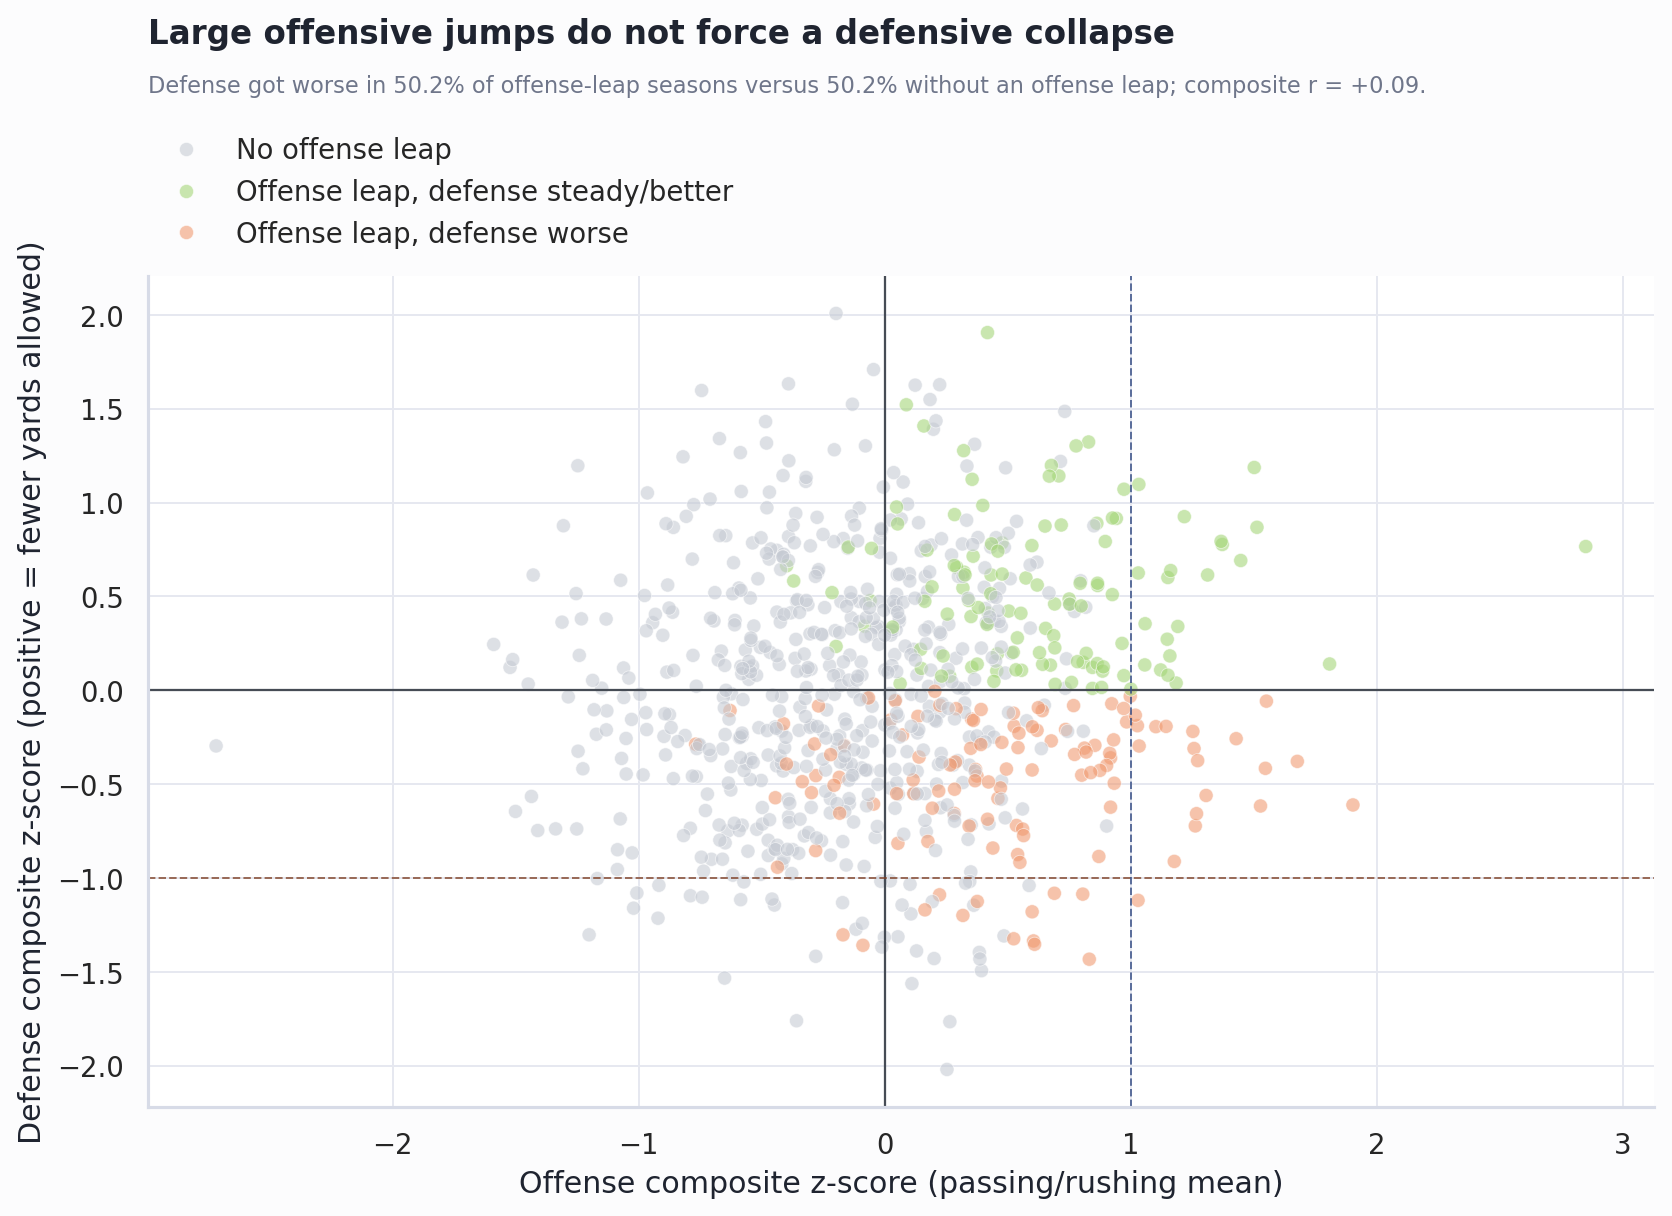
- Offensive jumps do not automatically punish the defense. Teams with a significant offensive leap had defenses get worse 50.2% of the time, essentially the same as teams without one.
- The 2026 screen is a watchlist. It flags teams with prior-year headroom plus multiple mechanism flags, but it still needs live injuries, projected depth charts, coordinator changes, and usage projections before it becomes action.
Previous-Year Yardage Is A Starting Prior
Prior-year yardage carries signal, but the scatter is wide. The best single relationship was offense passing, where previous-year passing yards explained about 30% of the next year’s level. That is useful. It is not close to enough for a one-variable projection.
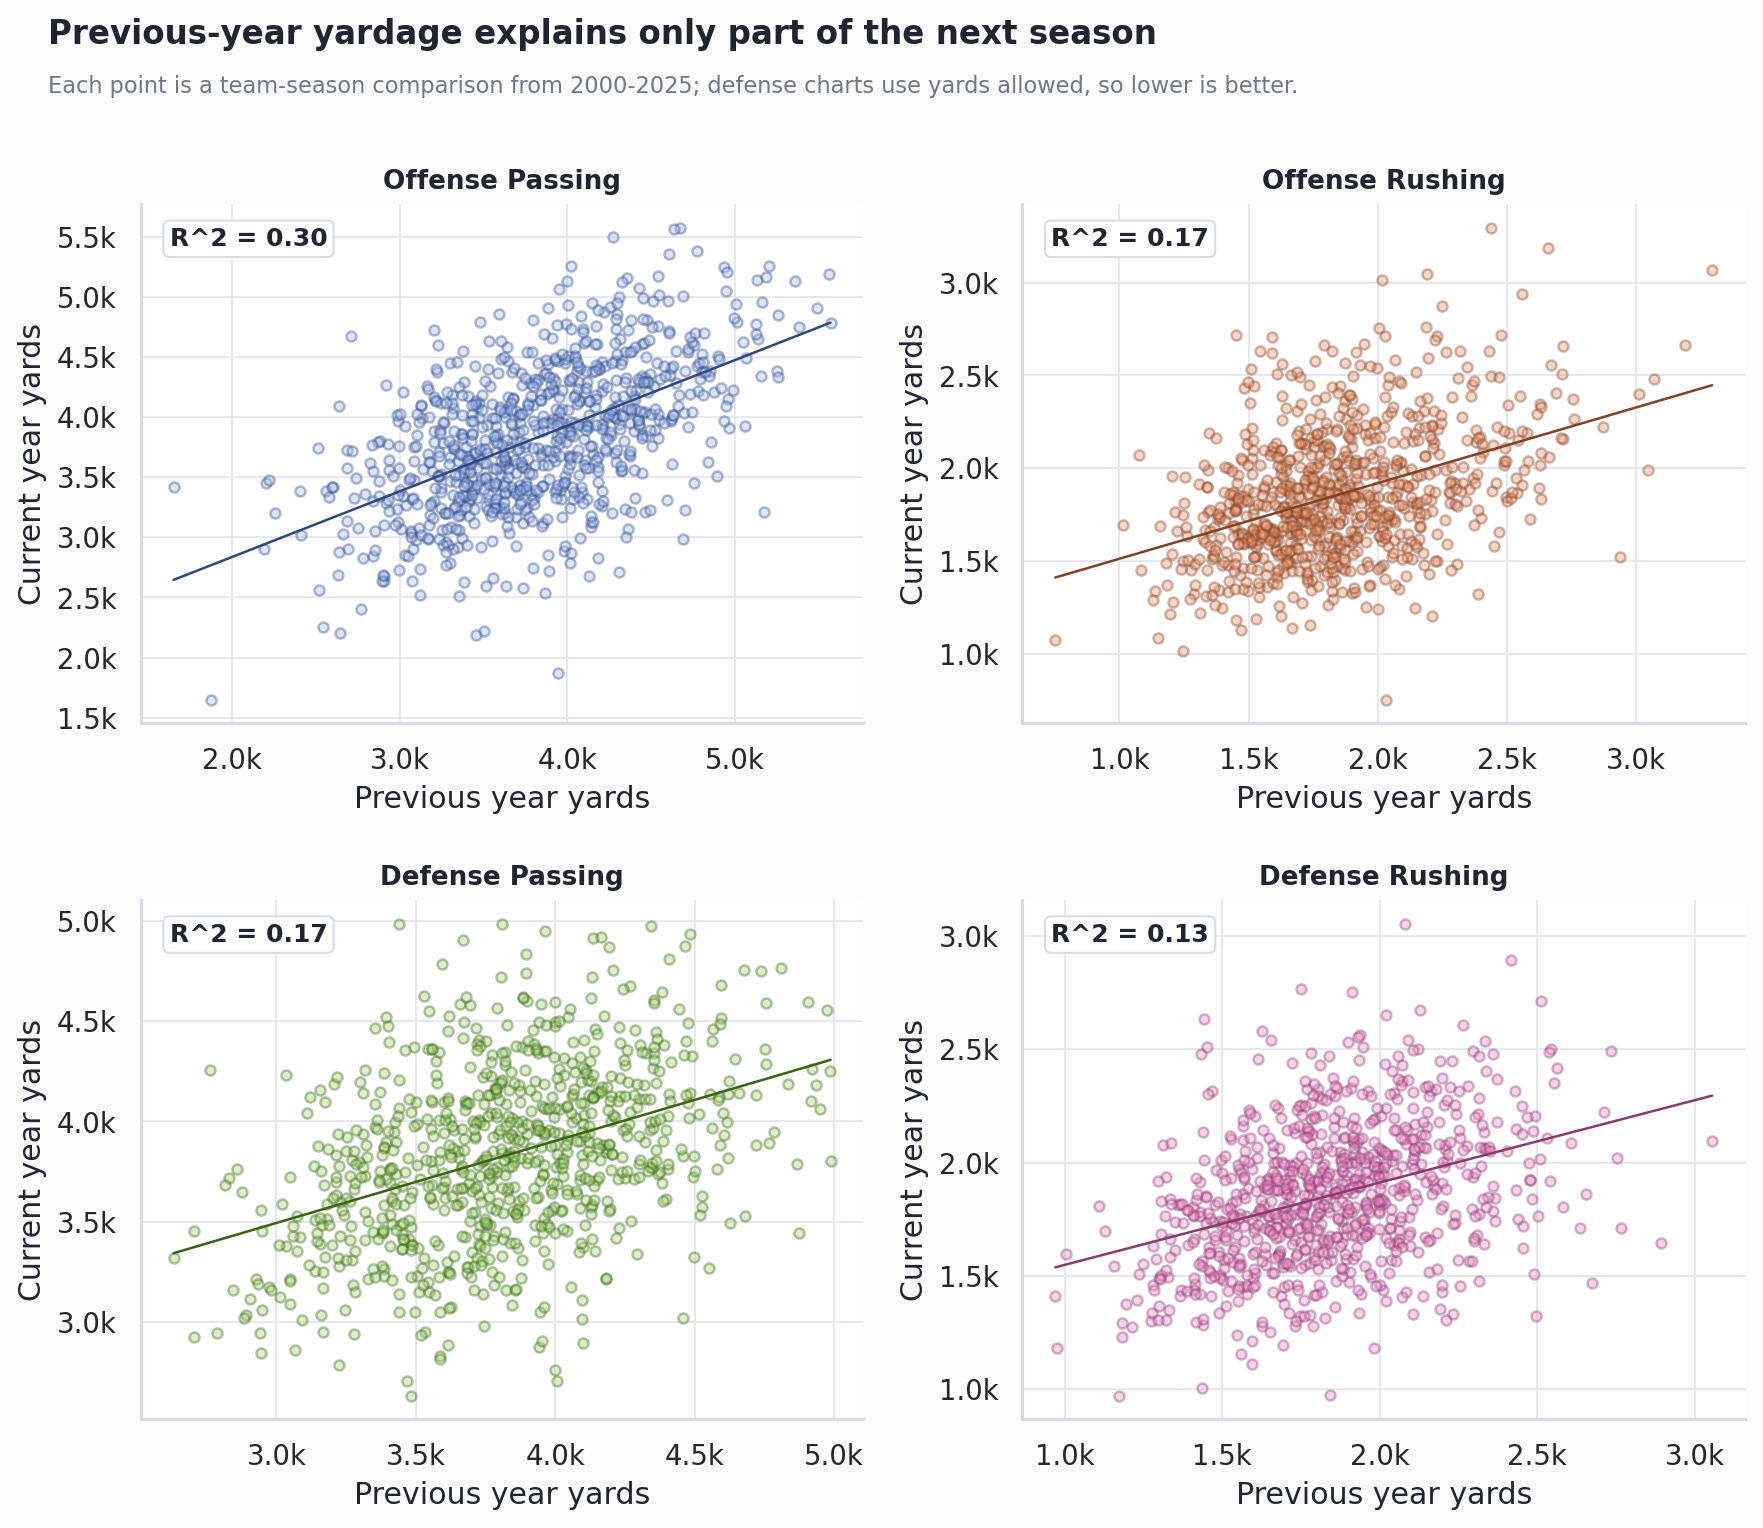
| Dimension | R | R2 | Median absolute change | Top-quartile repeat |
|---|---|---|---|---|
| Offense passing | +0.55 | 0.30 | 376 yards | 49.5% |
| Offense rushing | +0.41 | 0.17 | 257 yards | 37.0% |
| Defense passing | +0.41 | 0.17 | 329 yards | 37.3% |
| Defense rushing | +0.37 | 0.13 | 215 yards | 45.0% |
The right use is as a baseline. Start with last year’s environment, then ask what changed: quarterback, play volume, efficiency, schedule, offensive line, defensive personnel, coaching, and injury context.
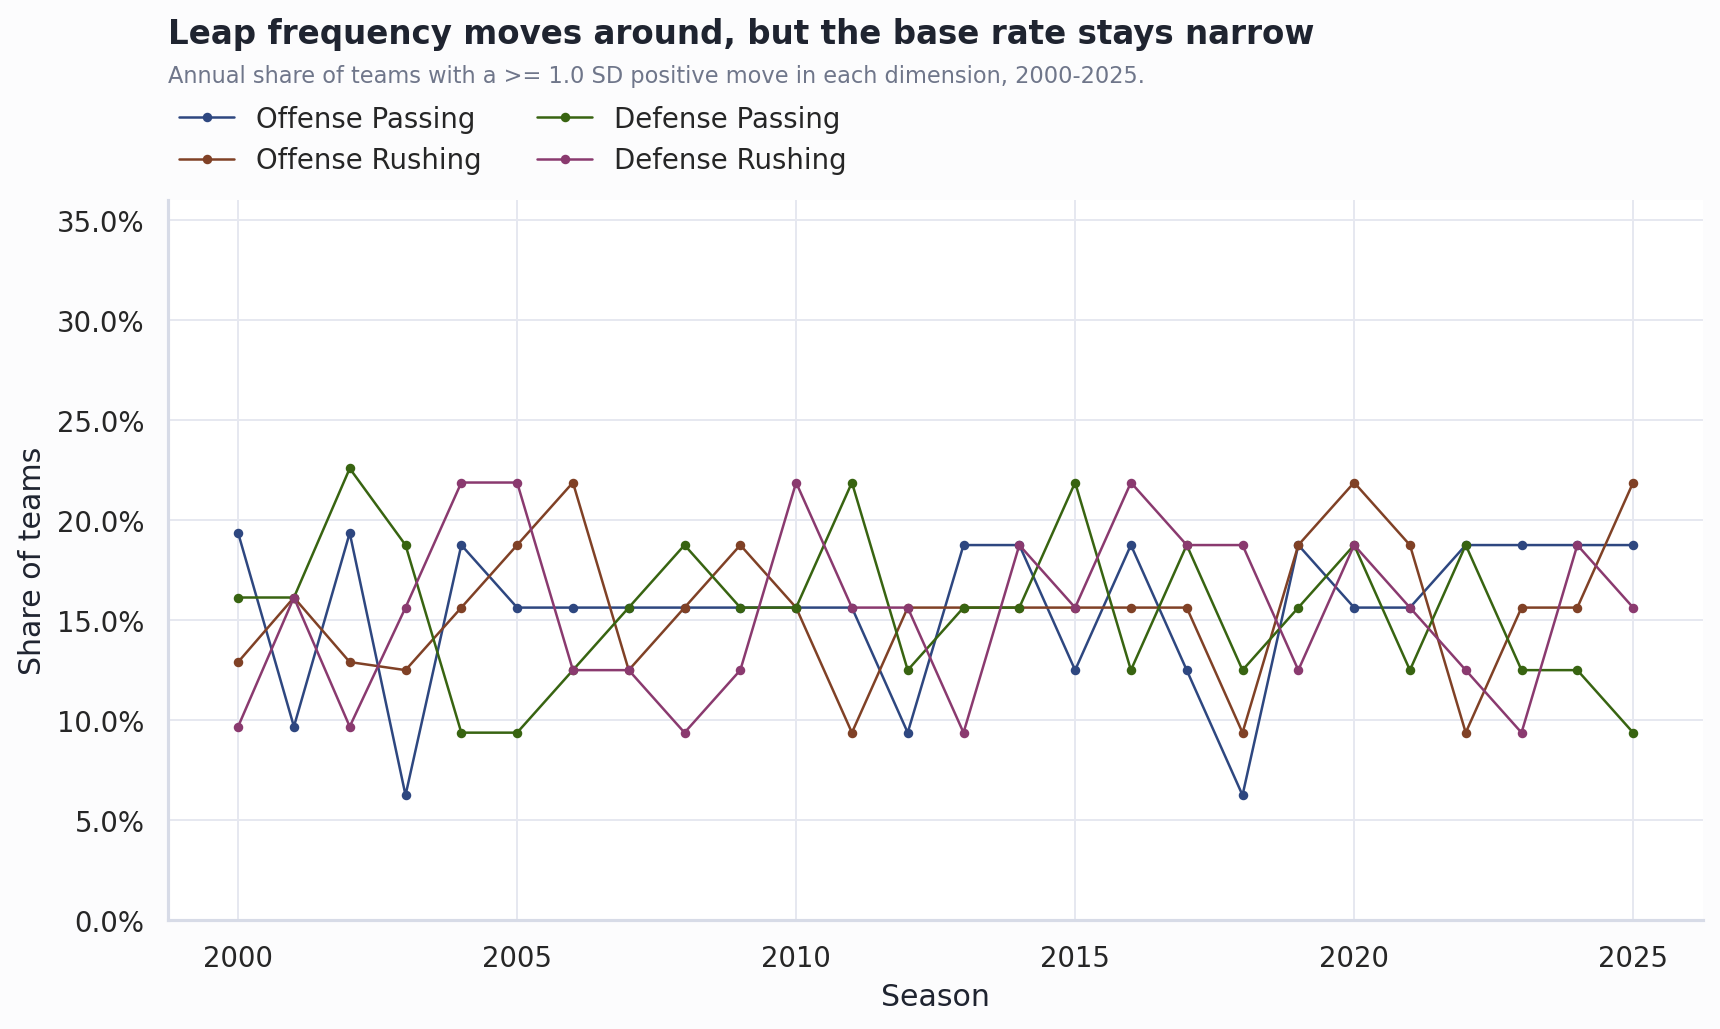
Real Leaps Happen, But The Base Rate Is Narrow
A significant leap here means the team’s year-over-year improvement was at least one standard deviation above the same-season league mean for that side and yardage type. Defense is oriented so a positive move means fewer yards allowed.
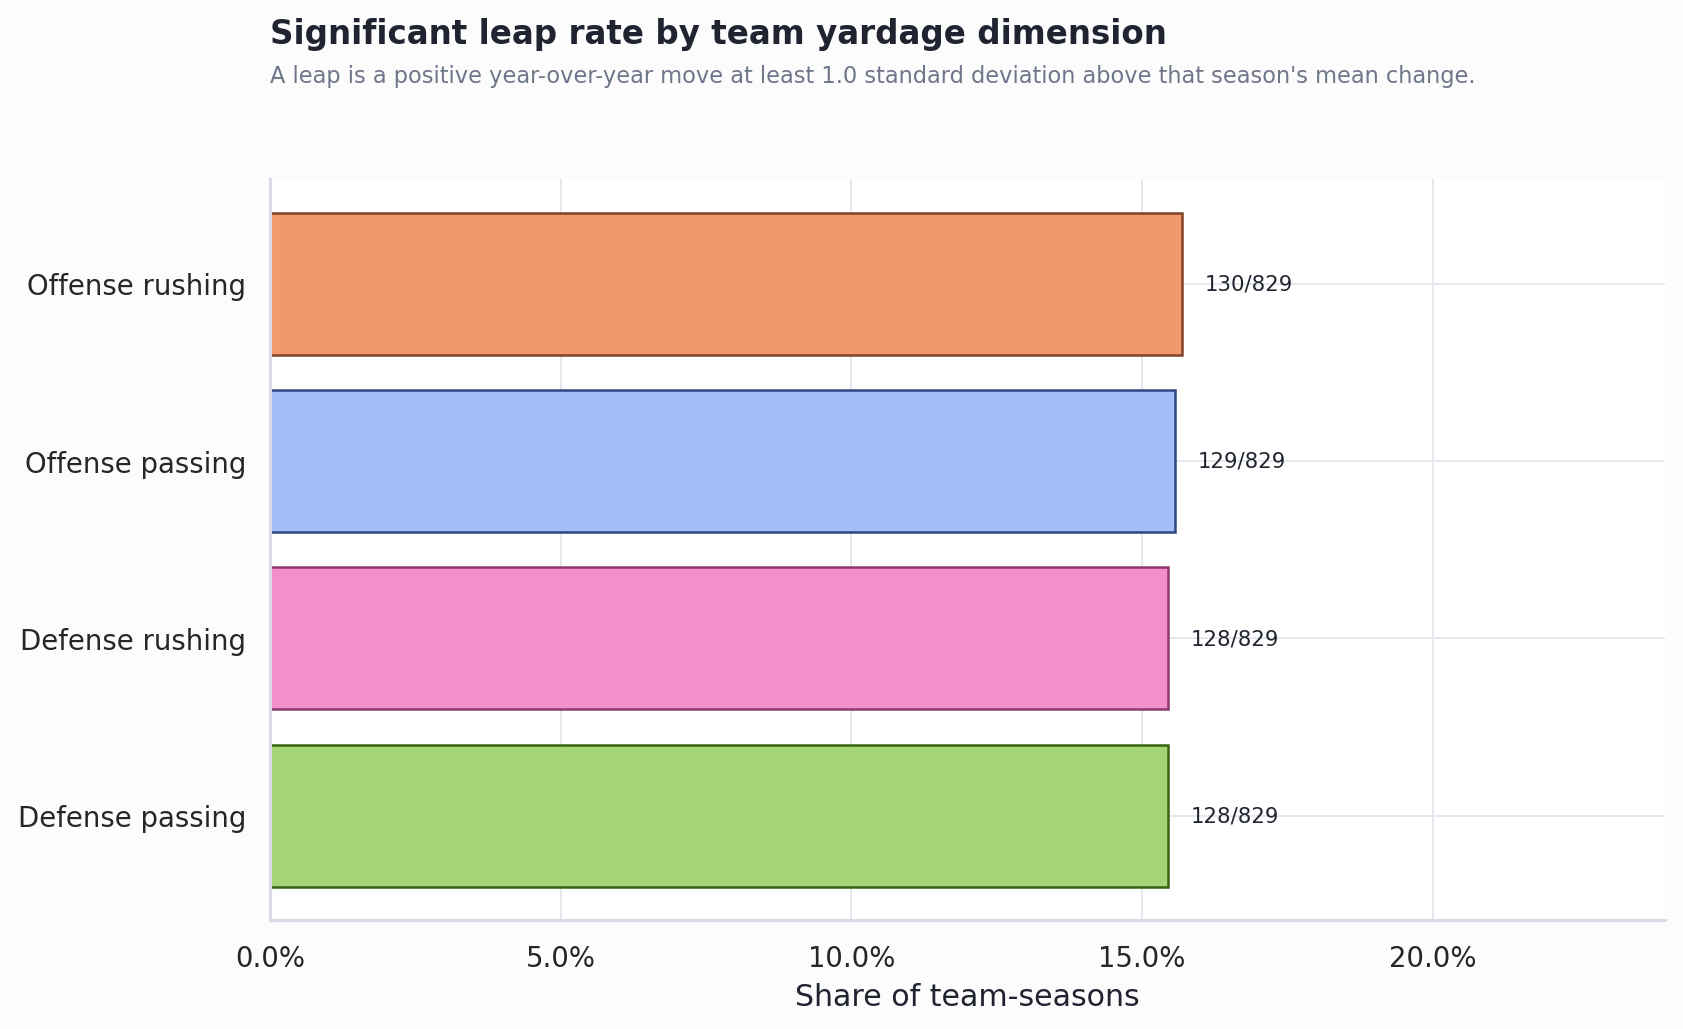
| Dimension | Observations | Significant leaps | Rate | Median leap |
|---|---|---|---|---|
| Offense passing | 829 | 129 | 15.6% | +824 yards |
| Offense rushing | 829 | 130 | 15.7% | +542 yards |
| Defense passing | 829 | 128 | 15.4% | +633 yards prevented |
| Defense rushing | 829 | 128 | 15.4% | +496 yards prevented |
That is high enough that every season will create real movers. It is also low enough that “this unit is due” should not be a draft-room argument by itself.
The Tail Is Big Enough To Matter
The largest jumps are not noise. They are the seasons that make fantasy managers want a shortcut: Peyton Manning arriving in Denver, major defensive turnarounds, or a rushing environment that suddenly gets unlocked.
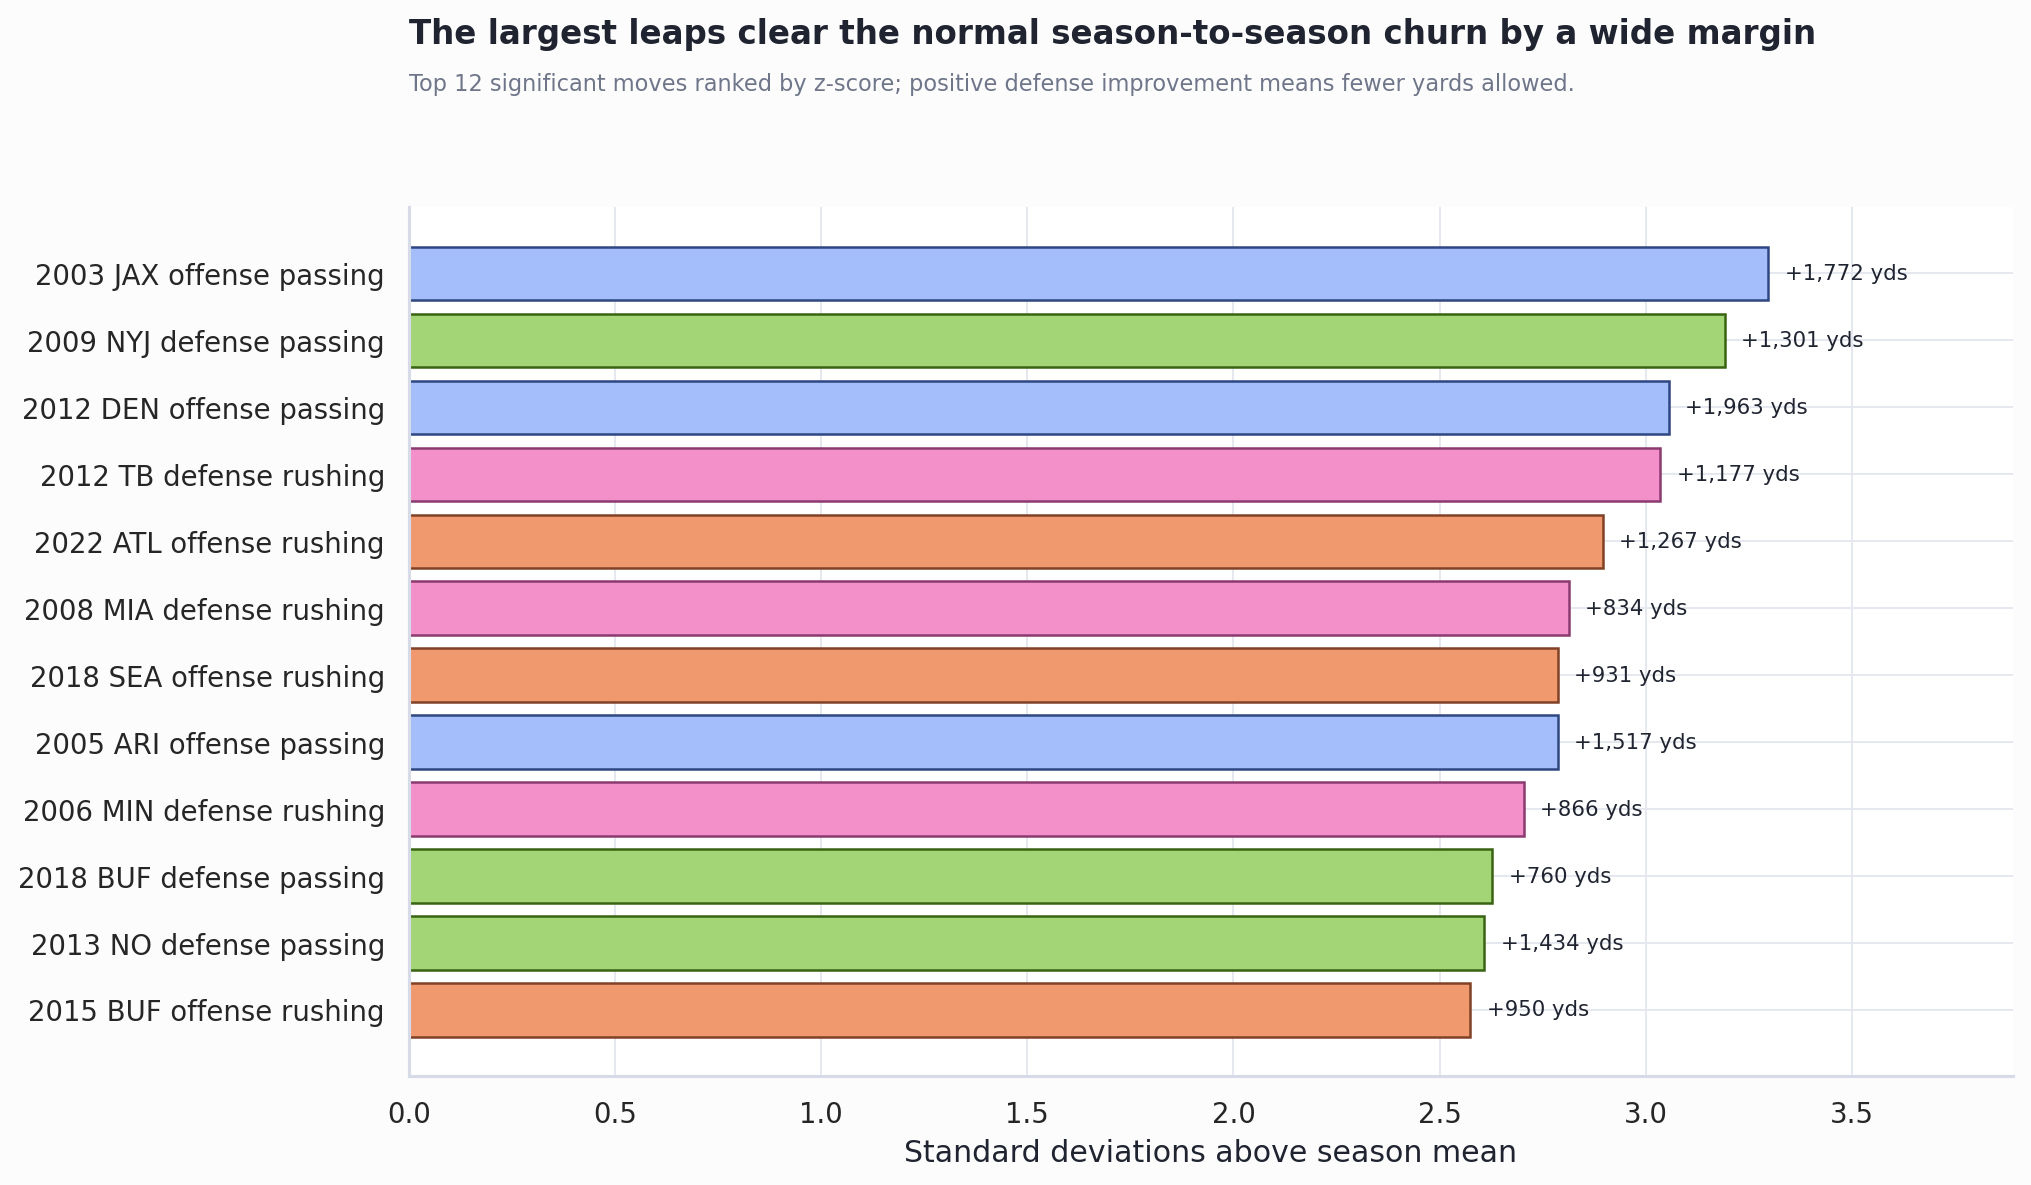
| Season | Team | Dimension | Improvement | Z |
|---|---|---|---|---|
| 2003 | JAX | Offense passing | +1,772 | 3.30 |
| 2009 | NYJ | Defense passing | +1,301 prevented | 3.19 |
| 2012 | DEN | Offense passing | +1,963 | 3.06 |
| 2012 | TB | Defense rushing | +1,177 prevented | 3.04 |
| 2022 | ATL | Offense rushing | +1,267 | 2.90 |
The lesson is not that the next version is easy to find. The lesson is that when a team environment really changes, the fantasy payoff can be large enough to justify a structured monitor.
Offense And Defense Mostly Move Separately
One common story is that a rising offense will hurt its own defense by increasing pace, pass rate, or shootout pressure. In this historical cut, that relationship is weak.
| Cohort | Team-seasons | Mean offense z | Mean defense z | Defense worse | Defense significant decline |
|---|---|---|---|---|---|
| All team-seasons | 829 | +0.00 | +0.00 | 50.2% | 27.7% |
| Any offense leap | 241 | +0.56 | +0.02 | 50.2% | 24.9% |
| No offense leap | 588 | -0.23 | -0.01 | 50.2% | 28.9% |
| Offense composite >= +1 SD | 41 | +1.31 | +0.07 | 46.3% | 26.8% |
The composite offense-defense correlation was only +0.09. For fantasy, that means offensive environment and defensive environment should be checked together, but one should not be assumed from the other.
Mechanisms Matter More Than The Yardage Shortcut
The local mechanism screen helped separate the useful next step from the tempting shortcut. Offense-leap seasons had median offensive EPA/play improvement of +0.08, compared with -0.02 for non-leap seasons. They also had more quarterback change: 50.2% versus 34.5%.
| Cohort | Team-seasons | Plays/g delta | Pass-rate delta | Off EPA/play delta | QB changed |
|---|---|---|---|---|---|
| Any offense leap | 241 | +1.50 | -1.6% | +0.08 | 50.2% |
| No offense leap | 588 | -0.55 | +0.5% | -0.02 | 34.5% |
| Passing offense leap | 129 | +1.81 | +4.1% | +0.08 | 48.8% |
| Rushing offense leap | 130 | +1.41 | -5.5% | +0.09 | 53.1% |
That points to the right workflow: use yardage history to identify teams worth studying, then validate the actual mechanism before turning it into player-level fantasy action.
2026 Watchlist
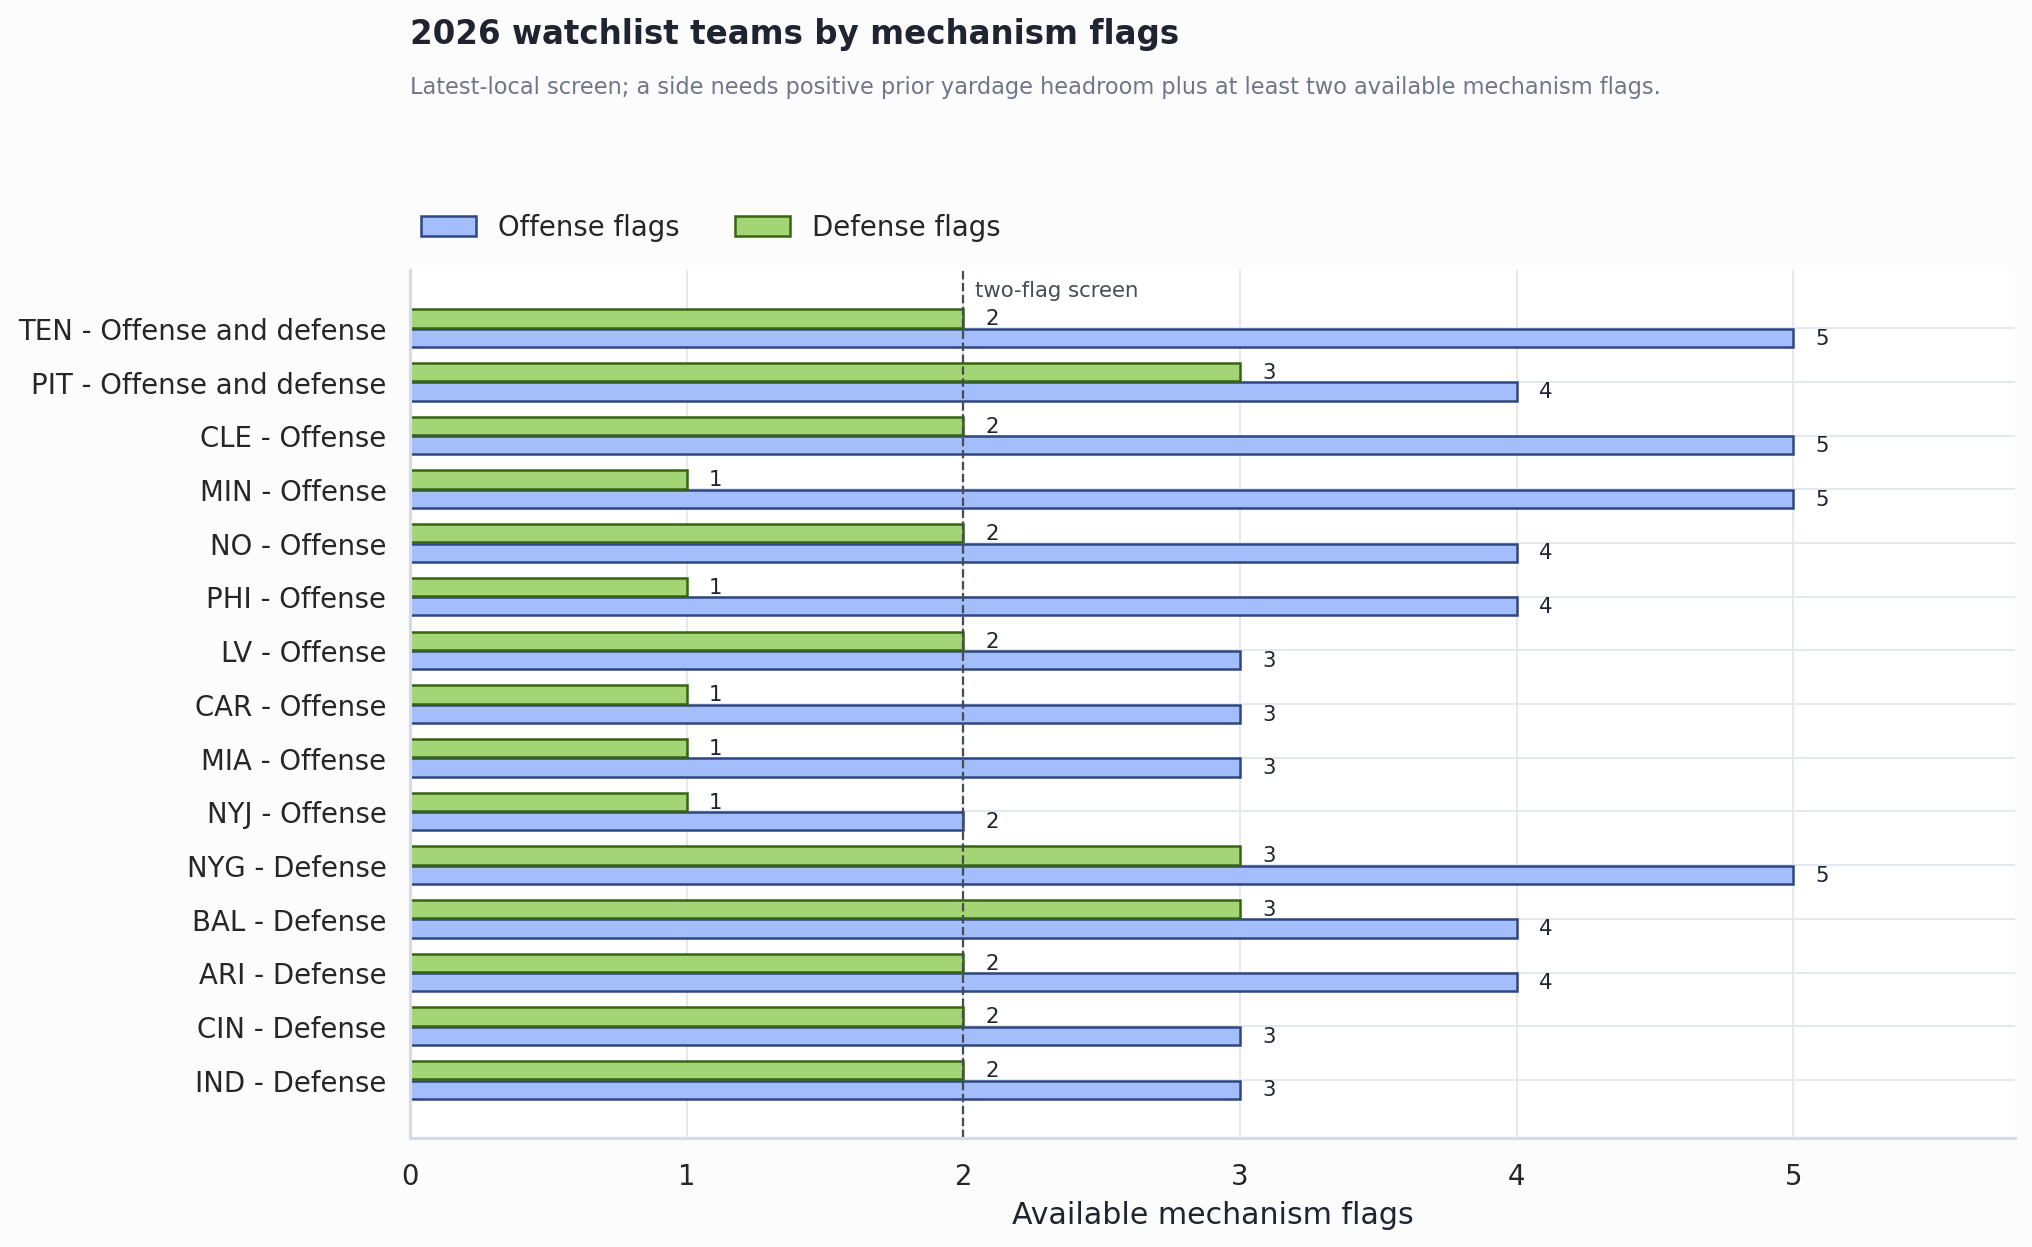
The 2026 monitor uses positive prior-year yardage headroom plus at least two mechanism flags. The local source layer includes opponent prior-year yardage schedule strength, prior-year injury burden, head-coach continuity, primary-QB continuity, returning production and snap continuity, and local ADP/value support.
| Bucket | Teams |
|---|---|
| Offense and defense | TEN, PIT |
| Offense only | CLE, MIN, NO, PHI, LV, CAR, MIA, NYJ |
| Defense only | NYG, BAL, ARI, CIN, IND |
This is not a buy list. It is a research queue. The offensive teams need player ADP, target/carry concentration, line health, quarterback quality, and play-caller review. The defensive teams matter for schedule and game-environment assumptions, but the report does not turn them into automatic matchup upgrades or downgrades.
Draft-room posture: use the monitor to decide which team environments deserve another look. Do not draft a player just because the team cleared the yardage screen.
Before Acting
- Refresh 2026 ADP and market context before using this for current draft decisions.
- Add projected depth charts, current injuries, coordinator changes, offensive-line health, and usage projections.
- Treat team-level yardage jumps as environment clues, not player allocation answers.
- Recheck whether a flagged team’s fantasy value is already fully priced into player ADP.
What Not To Carry Forward
| Signal | Why it is noise |
|---|---|
| Last year’s yardage ranking is a projection. | Year-over-year level has signal, but the R2 values leave substantial room for change. |
| A better offense means the defense must get worse. | The observed offense-defense relationship is weak, and the defense-worse rate barely moved. |
| The 2026 watchlist is actionable by itself. | Current injuries, depth charts, coordinator changes, and player usage projections are not fully live in the local source layer. |
Sources and freshness: Historical yardage, play-volume, EPA, and quarterback-continuity checks use local Dynasty Codex nflverse regular-season data through 2025. The 2026 monitor uses latest-local generated schedule, injury, coaching, continuity, roster, and market-support sources from June 30, 2026. This was not a live upstream refresh, current structured injuries stop at 2025 locally, depth charts stop at 2024 locally, and coordinator changes are not available in the local nflverse schedule layer.